2016年6月16日,LIGO合作组宣布2015年12月26日 03:38:53(UTC),两台不同位置的引力波探测器同时探测到了一个引力波信号。
引力波
物理学中,引力波是因为时空弯曲对外以辐射形式传播的能量。
爱因斯坦基于广义相对论语言了引力波的存在。
2016年6月16日,LIGO合作组宣布2015年12月26日 03:38:53(UTC),两台不同位置的引力波探测器同时探测到了一个引力波信号。
代码实现
1
2
3
4
5
6
7
8
9
10
11
12
13
14
15
16
17
18
19
20
21
22
23
24
25
26
27
28
29
30
31
32
33
34
35
36
37
38
39
40
41
42
43
44
45
46
47
48
49
50
51
52
53
54
55
|
"""
Created on Sun Feb 24 10:17:31 2019
@author: Administrator
"""
import numpy as np
import matplotlib.pyplot as plt
from scipy.io import wavfile
rate_h, hstrain = wavfile.read(r"H1_Strain.wav","rb")
rate_l, lstrain = wavfile.read(r"L1_Strain.wav","rb")
reftime, ref_H1 = np.genfromtxt('wf_template.txt').transpose()
htime_interval = 1 / rate_h
ltime_interval = 1 / rate_l
htime_len = hstrain.shape[0] / rate_h
htime = np.arange(-htime_len / 2, htime_len / 2, htime_interval)
ltime_len = lstrain.shape[0] / rate_l
ltime = np.arange(-ltime_len / 2, ltime_len / 2, ltime_interval)
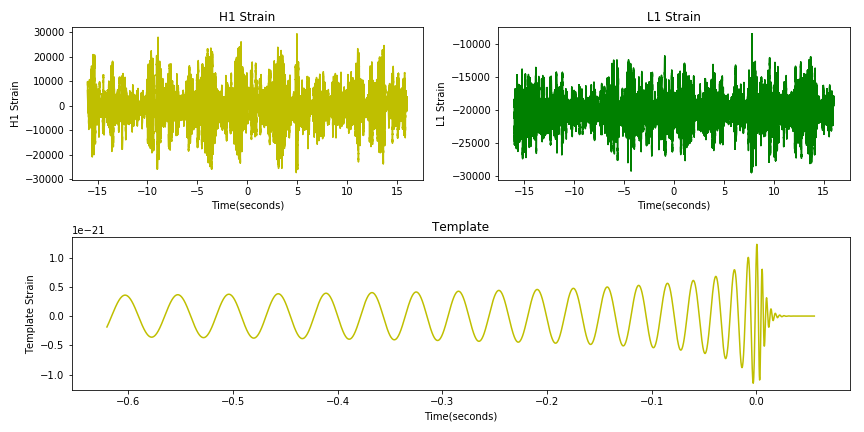
fig = plt.figure(figsize = (12, 6))
plth = fig.add_subplot(221)
plth.plot(htime, hstrain, 'y')
plth.set_xlabel('Time(seconds)')
plth.set_ylabel('H1 Strain')
plth.set_title('H1 Strain')
pltl = fig.add_subplot(222)
pltl.plot(ltime, lstrain, 'g')
pltl.set_xlabel('Time(seconds)')
pltl.set_ylabel('L1 Strain')
pltl.set_title('L1 Strain')
pltref = fig.add_subplot(212)
pltref.plot(reftime, ref_H1, 'y')
pltref.set_xlabel('Time(seconds)')
pltref.set_ylabel('Template Strain')
pltref.set_title('Template')
fig.tight_layout()
plt.savefig("Gravitational_Waves_Original.png")
plt.show()
plt.close(fig)
|
图像展示
数据源
http://python123.io/dv/grawave.html
http://python123.io/dv/H1_Strain.wav
http://python123.io/dv/L1_Strain.wav
http://python123.io/dv/wf_template.txt